Collecting behaviour data is only the first step. The real value comes from analysing the information to understand patterns, identify circumstances associated with behaviour, evaluate change over time and inform Functional Behaviour Assessment (FBA) and Positive Behaviour Support (PBS).
Behaviour data analysis should move beyond simply counting incidents. Good analysis asks what the data show, what they do not show, how confident we can be in an emerging pattern, and what additional information may be needed before drawing conclusions.
This guide explains how to analyse behaviour tracking data, including frequency, duration, intensity and ABC (Antecedent–Behaviour–Consequence) data, and how to use the findings to develop or refine a functional behaviour hypothesis.
What Is Behaviour Data Analysis?
Behaviour data analysis is the process of organising, comparing and interpreting information collected about behaviour over time.
Depending on the behaviour and the purpose of monitoring, data may include:
- frequency or count
- rate
- duration
- intensity
- ABC behaviour data
- time of day
- location or setting
- activity
- people present
- setting events and broader contextual factors
- use of communication or replacement skills
- progress towards individual goals
The aim is not to find a pattern at any cost. It is to determine whether the available information supports a meaningful and repeatable pattern and to distinguish observation from interpretation.
Step 1: Check the Quality of the Data Before Analysing It
Before interpreting behaviour data, check whether the information is sufficiently consistent and meaningful.
Ask:
- Is the behaviour clearly defined in observable and measurable terms?
- Are different people recording the same behaviour in the same way?
- Are dates, times and observation periods recorded accurately?
- Are there large gaps in the data?
- Has the amount of observation or opportunity changed?
- Are intensity ratings based on defined criteria rather than subjective impressions?
- Are ABC records factual, or do they contain assumptions about why behaviour occurred?
- Has behaviour only been recorded when a major incident occurred?
Poor-quality data can create misleading patterns. If the recording process changed halfway through the monitoring period, apparent improvement or deterioration may reflect the change in measurement rather than a genuine change in behaviour.
Step 2: Analyse Frequency and Rate
Frequency tells you how many times a behaviour occurred. Begin by looking at counts across comparable periods such as days, weeks or months.
Consider:
- Is frequency increasing, decreasing or relatively stable?
- Are there sudden changes?
- Does behaviour cluster on particular days, activities or settings?
- Did the person’s opportunities to engage in the behaviour change?
Raw counts should be interpreted carefully. Ten incidents during a ten-hour observation period are different from ten incidents during two hours.
Where observation time varies, calculate a rate, for example:
Rate = Number of occurrences ÷ Observation time
Opportunity-based measures may be more useful when behaviour can only occur in particular situations. For example, rather than reporting five difficulties with transitions, consider how many transitions occurred overall.
Step 3: Analyse Duration
Duration data show how long behaviour lasts. Analyse both the total duration and, where useful, the average duration of individual episodes.
A behaviour may occur just as often but become substantially shorter. Conversely, frequency may decrease while the remaining episodes become much longer.
This is why frequency alone can provide an incomplete picture.
Step 4: Analyse Intensity
Intensity describes the magnitude or severity of behaviour. If intensity is being tracked, use defined anchors that describe observable differences between levels.
For example, an intensity scale should specify what Level 1, Level 2 and Level 3 actually look like rather than relying on labels such as mild, moderate and severe without criteria.
When reviewing intensity data, ask whether the average or highest intensity is changing and whether particular contexts are associated with higher-intensity episodes.
Step 5: Look at Behaviour Over Time
Graphs and simple summaries can make trends easier to see than raw incident records.
Useful displays may include:
- frequency by day or week
- rate over time
- average duration
- maximum or average intensity
- behaviour by time of day
- behaviour by activity or setting
- behaviour before and after a strategy was introduced
Look for overall trends, but do not overinterpret short-term fluctuations. Behaviour is affected by context, and a few unusually high or low days may not represent a stable change.
Where a strategy was introduced, note when implementation began. This helps you compare patterns before and after the change, while remembering that an observed change does not automatically prove that the strategy caused it.
Step 6: Analyse ABC Behaviour Data
ABC data records what happened immediately before a behaviour, the observable behaviour itself and what happened immediately afterwards.
ABC stands for:
Antecedent – what happened immediately before the behaviour.
Behaviour – what the person did or said.
Consequence – what happened immediately after the behaviour.
To analyse ABC data, review multiple records for the same clearly defined behaviour rather than interpreting incidents one at a time.
How to Analyse Antecedents
Group similar antecedents and look for recurring circumstances.
Examples might include:
- a particular type of demand
- transition between activities
- waiting
- an activity ending
- access being delayed
- a particular interaction
- high noise or sensory load
- unstructured time
- difficulty communicating a need
Then ask an important comparison question: does the same antecedent sometimes occur without the behaviour? If so, what is different about those occasions?
How to Analyse Consequences
Review what commonly happens after behaviour.
For example:
- a demand stops or is delayed
- someone provides interaction
- the person gains access to an item or activity
- other people move away
- the environment becomes quieter
- the person leaves the situation
- additional support is provided
A recurring consequence may help generate a hypothesis about what the behaviour achieves or changes for the person. However, a consequence occurring after behaviour does not by itself prove that it is maintaining the behaviour.
Look Beyond the Immediate ABC
Immediate antecedents and consequences are only part of the picture. Broader setting events can change how likely behaviour is to occur.
Depending on the individual, relevant factors may include:
- sleep and fatigue
- pain, illness or discomfort
- hunger
- sensory load
- changes in routine
- significant events
- communication difficulties
- relationship factors
- reduced predictability
- cumulative demands
Only include factors supported by the available information. Avoid assuming that a generic list of possible setting events applies to the person.
Step 7: Compare When Behaviour Does and Does Not Occur
Analysis often focuses exclusively on incidents. This can hide some of the most useful information.
Ask:
- When is the behaviour least likely?
- What activities go well?
- Which environments appear more supportive?
- Are there people or interaction styles associated with better outcomes?
- What supports are present during successful situations?
- Does the person have more choice, predictability, communication support or access to regulation in these situations?
Comparing successful and difficult situations can identify protective or supportive factors that are directly relevant to preventative strategies.
Step 8: Look for Patterns Across Multiple Variables
Avoid analysing each variable in isolation. Behaviour may be associated with a combination of factors.
For example, a pattern may not simply be ‘demands cause behaviour’. The data may instead show that behaviour is most likely when difficult demands are presented late in the day, after poor sleep, with limited preparation and no easy way for the person to request assistance or a break.
This produces a more clinically useful understanding than identifying a single trigger.
Step 9: Develop or Refine a Functional Behaviour Hypothesis
Once patterns emerge, use them alongside interviews, observations, records and other assessment information to develop or refine a functional hypothesis.
A useful hypothesis summarises:
- relevant setting events or contributing factors
- the circumstances in which behaviour is most likely
- the observable behaviour
- what commonly happens afterwards
- what the behaviour may achieve, avoid, communicate or regulate
- the strength and limitations of the available evidence
For example:
When Sam arrives home fatigued after school and is immediately presented with additional demands or sustained social interaction, he is more likely to yell, push items away and withdraw. These behaviours are frequently followed by demands being delayed and Sam being given space. The available information suggests the behaviour may function, at least in part, to escape or delay demands and interaction when Sam is fatigued and requires reduced stimulation and time to regulate.
If the evidence is limited, describe the hypothesis as preliminary or emerging. If different patterns are present, retain multiple plausible hypotheses rather than forcing all incidents into one explanation.
Association Is Not the Same as Causation
Behaviour data frequently identify associations. For example, behaviour may occur more often during transitions or after poor sleep.
This does not automatically mean that the transition or poor sleep caused the behaviour. Other variables may be involved, and descriptive data alone may not establish causation.
Use language that matches the evidence: ‘was associated with’, ‘occurred more frequently when’, ‘the pattern suggests’ or ‘may contribute to’ can be more accurate than stating that a variable caused the behaviour.
Step 10: Use the Analysis to Inform Positive Behaviour Support
The purpose of analysing behaviour data is not simply to produce a graph or label a function. Findings should inform practical support.
Depending on the assessment, this may include:
Supportive Environments – environmental accommodation, greater predictability, and environmental or sensory changes supported by the assessment.
Supportive Activities – changes to demands or task presentation, access to preferred and meaningful activities, pacing, choice and opportunities for participation.
Supportive Interactions – communication support and changes to how supporters interact with the person.
- meaningful choice and control
- skill development
- early intervention strategies
- safe and respectful response strategies
Strategies should be directly connected to the identified pattern rather than selected from a generic list.
Step 11: Monitor Whether Strategies Are Working
Continue collecting relevant data after strategies are introduced.
Do not look only for a reduction in behaviour of concern. Depending on the person’s goals, meaningful outcomes may include:
- increased communication
- greater participation
- more successful transitions
- increased independence
- reduced risk
- shorter or lower-intensity episodes
- greater choice and autonomy
- use of new skills
- improved quality of life
If outcomes are not improving, consider whether the hypothesis was accurate, whether strategies were implemented as intended, whether circumstances changed or whether additional assessment is required.
Behaviour Data Analysis Example
Suppose behaviour records show that Alex has 18 episodes of distress across a two-week period.
Looking only at the total count tells us very little. Further analysis shows:
14 of the 18 episodes occurred during transitions away from a preferred activity.
12 occurred in the afternoon.
10 occurred on days when support notes described Alex as tired.
When a five-minute warning and a clear choice of the next activity were provided, transitions were usually completed without distress.
When distress occurred, the transition was often delayed.
This pattern does not prove a single cause. However, it suggests that fatigue, transitions away from preferred activities, predictability and delay of the transition may all be relevant to the functional assessment.
A useful next step would be to integrate this pattern with information from Alex and people who know them well, consider communication and sensory factors, and test whether individualised preventative strategies improve transition outcomes.
Common Mistakes When Analysing Behaviour Data
- Looking only at frequency and ignoring duration, intensity or context.
- Treating every incident as though it has the same function.
- Assuming the most common antecedent caused the behaviour.
- Assuming the most common consequence proves the function.
- Using subjective labels instead of observable definitions.
- Ignoring differences in observation time or opportunities.
- Analysing incidents without examining successful situations.
- Drawing conclusions from too little data.
- Collecting large amounts of data without periodically reviewing it.
- Ignoring evidence that does not fit the preferred hypothesis.
- Focusing only on behaviour reduction rather than quality-of-life outcomes.
How Behaviour Help Supports Behaviour Data Collection and Analysis
Behaviour data are often spread across incident forms, ABC charts, spreadsheets, progress notes, graphs and separate assessment documents. This can make it difficult to move from data collection to meaningful analysis.
The Behaviour Help App supports practitioners to bring behaviour data together with broader Functional Behaviour Assessment information so that patterns can be reviewed in the context of the person’s assessment.
This supports a clearer pathway, mirroring the seven steps of a Functional Behaviour Assessment:
The purpose is not to replace professional judgement. Practitioners remain responsible for interpreting the evidence, considering alternative explanations and determining what conclusions and strategies are justified by the available information.
Frequently Asked Questions About Behaviour Data Analysis
How do I analyse behaviour tracking data?
Start by checking data quality, then examine frequency or rate, duration, intensity and trends over time. Review ABC and contextual data for recurring patterns, compare situations in which behaviour does and does not occur, and integrate the findings with other assessment information before developing a functional hypothesis.
How do I identify patterns in behaviour data?
Compare behaviour across time, activities, environments, people, antecedents, consequences and broader setting events. Look for repeated associations rather than isolated incidents, and examine successful situations as well as incidents.
How do I analyse ABC data?
Group ABC records for the same behaviour and compare recurring antecedents, contextual factors and consequences. Consider whether the same antecedents occur without behaviour and whether different patterns may reflect different functions. ABC data should contribute to a functional hypothesis rather than being treated as proof of function.
Should I graph behaviour data?
Graphs can make changes and patterns easier to identify, particularly for frequency, rate, duration and intensity over time. The graph should answer a meaningful question and be interpreted alongside contextual information rather than in isolation.
What is the difference between frequency and rate?
Frequency is the number of times behaviour occurred. Rate adjusts the count for observation time, such as occurrences per hour. Rate is often more meaningful when observation periods differ.
How much behaviour data do I need before identifying a function?
There is no universal number of observations that guarantees a valid functional conclusion. The amount and type of information required depend on the behaviour, variability across contexts, risk, data quality and whether evidence from different sources converges. Use confidence language that reflects the strength of the available evidence.
Can behaviour data tell me why a behaviour occurs?
Behaviour data can identify patterns and contribute important evidence about possible function, but descriptive data alone may not establish causation. Functional understanding should integrate behaviour data with broader assessment information and professional judgement.
What should I do if the behaviour data show no clear pattern?
Do not invent one. Review whether the behaviour is clearly defined, whether the right variables are being recorded, whether data are being collected across relevant contexts and whether different behaviours or functions have been grouped together. Additional assessment may be needed.
Final Thoughts
Behaviour tracking becomes clinically useful when data are converted into understanding.
A strong analysis does more than report how many incidents occurred. It examines how behaviour changes over time, considers context, identifies repeated patterns, tests those patterns against situations in which behaviour does not occur and integrates the findings with the broader Functional Behaviour Assessment.
The aim is not to make the data fit a predetermined explanation. It is to use the available evidence carefully and transparently to develop better, more individualised Positive Behaviour Support.
For more information:
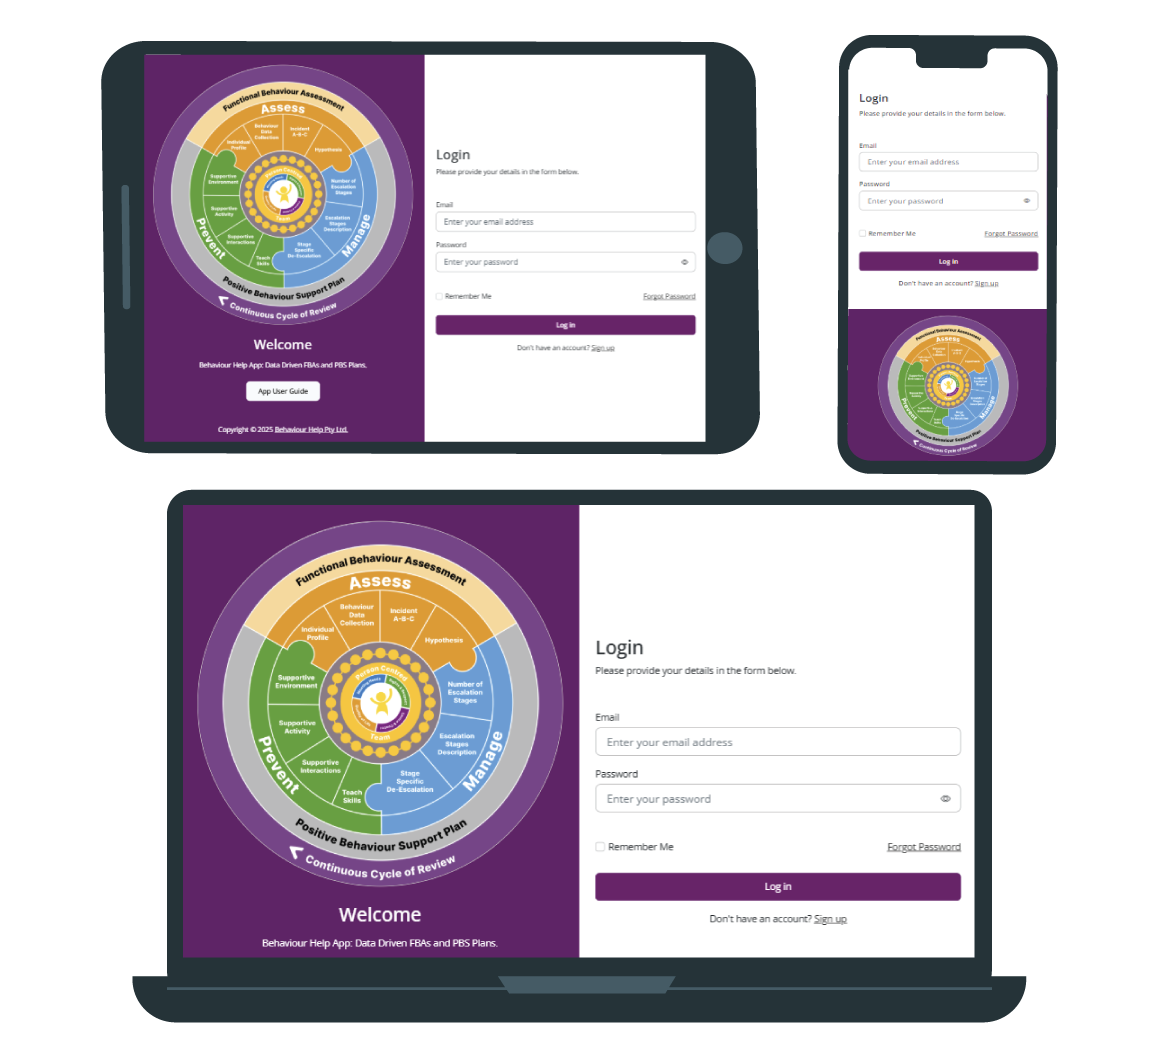
Introducing...The Behaviour Help App
Your All-in-One Platform for FBAs and PBS Plans
You’re doing important work. That’s why we built the Behaviour Help App — to make it easier to track behaviour trends, identify patterns, and develop meaningful, person-centred strategies.